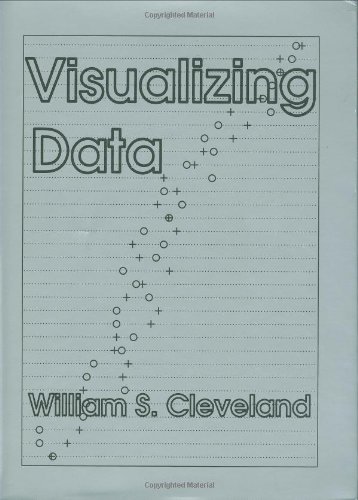
Visualizing Data / William S. Cleveland,
| List Price: | |
Our Price: $43.15 | |
|
For Bulk orders
| |
|
Used Book Price: | |
| Visualizing Data / William S. Cleveland, | |
| Publisher: Hobart Press | |
| Availability: | |
| Sales Rank: 391140 | |
|
Similar Books
Visualizing Data is about visualization
tools that provide deep insight into the
structure of data. There are graphical
tools such as coplots, multiway dot plots,
and the equal count algorithm. There are
fitting tools such as loess and bisquare
that fit equations, nonparametric curves,
and nonparametric surfaces to data.
But the book is much more than just a
compendium of useful tools. It conveys a
strategy for data analysis that stresses
the use of visualization to thoroughly
study the structure of data and to check
the validity of statistical models fitted
to data. The result of the tools and the
strategy is a vast increase in what you can
learn from your data. The book demonstrates
this by reanalyzing many data sets from the
scientific literature, revealing missed
effects and inappropriate models fitted
to data.
Now you can buy Books online in USA,UK, India and more than 100 countries.
*Terms and Conditions apply
Disclaimer: All product data on this page belongs to .
.
No guarantees are made as to accuracy of prices and information.
tools that provide deep insight into the
structure of data. There are graphical
tools such as coplots, multiway dot plots,
and the equal count algorithm. There are
fitting tools such as loess and bisquare
that fit equations, nonparametric curves,
and nonparametric surfaces to data.
But the book is much more than just a
compendium of useful tools. It conveys a
strategy for data analysis that stresses
the use of visualization to thoroughly
study the structure of data and to check
the validity of statistical models fitted
to data. The result of the tools and the
strategy is a vast increase in what you can
learn from your data. The book demonstrates
this by reanalyzing many data sets from the
scientific literature, revealing missed
effects and inappropriate models fitted
to data.
Now you can buy Books online in USA,UK, India and more than 100 countries.
*Terms and Conditions apply
Disclaimer: All product data on this page belongs to
 .
.No guarantees are made as to accuracy of prices and information.


