Now You See It: Simple Visualization Techniques for Quantitative Analysis teaches simple, practical means to explore and analyze quantitative data--techniques that rely primarily on using your eyes. This book features graphical techniques that can be applied to a broad range of software tools, including Microsoft Excel, because so many people have nothing else, but also more powerful visual analysis tools that can dramatically extend your analytical reach. You'll learn to make sense of quantitative data by discerning the meaningful patterns, trends, relationships, and exceptions that measure your organization's performance, identify potential problems and opportunities, and reveal what will likely happen in the future. Now You See It is not just for those with "analyst" in their titles, but for everyone who's interested in discovering the stories in their data that reveal their organization's performance and how it can be improved.
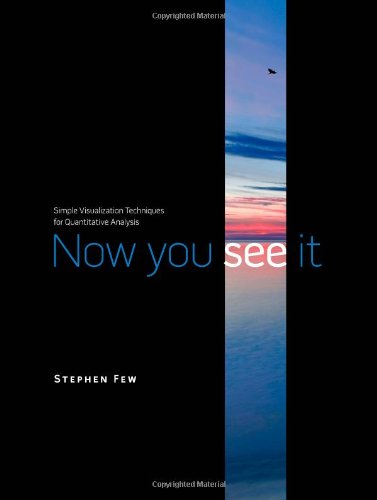
Now You See It: Simple Visualization Techniques for Quantitative Analysis
📄 Viewing lite version
Full site ›
Book Details
Author(s)Few, Stephen
PublisherAnalytics Press
ISBN / ASIN0970601980
ISBN-139780970601988
AvailabilityIn Stock.
Sales Rank31,103
MarketplaceUnited States 🇺🇸
Description ▲
Similar Products ▼
- Show Me the Numbers: Designing Tables and Graphs to Enlighten
- Information Dashboard Design: Displaying Data for At-a-Glance Monitoring
- Visualize This: The FlowingData Guide to Design, Visualization, and Statistics
- Reading Educational Research: How to Avoid Getting Statistically Snookered
- Turning Numbers into Knowledge: Mastering the Art of Problem Solving
- The Data Loom: Weaving Understanding by Thinking Critically and Scientifically with Data
- Storytelling with Data: A Data Visualization Guide for Business Professionals
- Stat-Spotting: A Field Guide to Identifying Dubious Data
- Signal: Understanding What Matters in a World of Noise
- The Wall Street Journal Guide to Information Graphics: The Dos and Don'ts of Presenting Data, Facts, and Figures