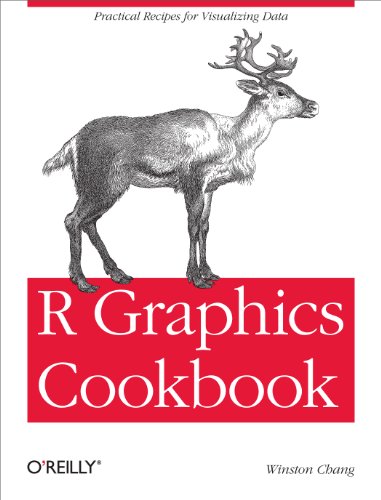
R Graphics Cookbook: Practical Recipes for Visualizing Data / Chang, Winston
| List Price: | |
Our Price: $59.95 | |
|
For Bulk orders
| |
|
Used Book Price: | |
| R Graphics Cookbook: Practical Recipes for Visualizing Data / Chang, Winston | |
| Publisher: O'Reilly Media | |
| Availability:In Stock. | |
| Sales Rank: 85402 | |
|
Similar Books
Q&A with Winston Chang, author of "R Graphics Cookbook: Practical Recipes for Visualizing Data"

Q. Why is your book timely?
A. Interest in R for data analysis and visualization has exploded in recent years. In the computer-tech world, computers and networks have made it much easier to gather and organize data, and more and more people have recognized that there's useful information to be found. To illustrate, consider the job "data scientist": this is a job title that didn't even exist five years ago, and now it's one of the hottest tickets on the market.
At the same time, there's been a swell of interest in R in its more traditional setting, in science and engineering. I think there are many reasons for this. One, is that there's a growing recognition outside of the computer-programmer world that learning a little programming can save you a lot of time and reduce errors. Another reason is that the last few years have seen an improvement in the user-friendliness of tools for using R.
So there's a lot of interest in using R for finding information in data, and visualization an essential tool for doing this. Data visualizations can help you understand your data and find patterns when you're in the exploratory phase of data analysis, and they are essential for communicating your findings to others.
Q. What information do you hope that readers of your book will walk away with?
A. As my book is a Cookbook, the primary goal is to efficiently present solutions for visualizing data, without demanding a large investment of time from the reader. For many readers, the goal is to just figure out how to make a particular type of graph and be done with it.
There are others who will want to gain a deeper understanding of how graphing works in R. For these readers, I've written an appendix on the graphing package ggplot2, which is used extensively in the recipes in the book. This appendix explains some of the concepts in the grammar of graphics, and how they relate to structures common to data visualizations in general.
Finally, I hope that readers will find ideas and inspiration for visualizing their data by browsing the pages and looking at the pictures.
Q. What's the most exciting/important thing happening in your space?
A. I'm excited that R is becoming more and more accessible to users who don't primarily identify as programmers. Many scientists, engineers, and data analysts have outgrown programs that provide canned data analysis routines, and they're turning increasingly to R. The growing popularity of R is part of a virtuous circle: as R gains a larger user base, it encourages people to create better educational materials and programming tools for R, which in turn helps to grow the number of R users.
Technology-wise, I'm excited by Shiny, which is a framework for bringing R analyses to the web. (I should mention that this it's part of my job to work on the development of Shiny.) This makes it possible to build interactive applications for data analysis and visualization for users who don't need to know R, or even that the application is backed by R.
Now you can buy Books online in USA,UK, India and more than 100 countries.
*Terms and Conditions apply
Disclaimer: All product data on this page belongs to
 .
.No guarantees are made as to accuracy of prices and information.


